This new post from Sharon Howard (@sharon_howard) is cross-posted on her own Exploring the Power of Petitioning site.
Cheshire Quarter Sessions petitions
I’m focusing on Cheshire quarter sessions because I’ve already done the work coding responses for this collection. I’d like to compare with some of The Power Of Petitioning’s other transcribed collections, but that’ll take quite a bit of work which I don’t have time to do at present.
The data
I’m working with a sample of 613 petitions from the Cheshire QS files between 1573 and 1798. I photographed all surviving petitions from every year ending in -8 between 1608 and 1798, plus every pre-1600 calendared petition. (My estimate is that there are in total about 5000 petitions in the files.) TPOP transcribed all the 16th-century petitions and a 1-in-20-year sample for the 17th and 18th centuries (years -08, -18, -38, -58, -78, -98); I abstracted the rest, and encoded all the responses.
I’m using only responses written on the petitions. This may miss a few responses recorded in separate documents, though I haven’t found any while consulting the files. I’ve also examined the 17th-century QS order books, but haven’t found additional responses there; they’re more useful for fleshing out the reasoning behind the brief summaries on the petitions.
I’ve decided to treat the absence of a recorded response as a type of negative response given that there are high response rates generally – about 70% of the petitions have an annotated response – and responses don’t seem to be recorded anywhere else.
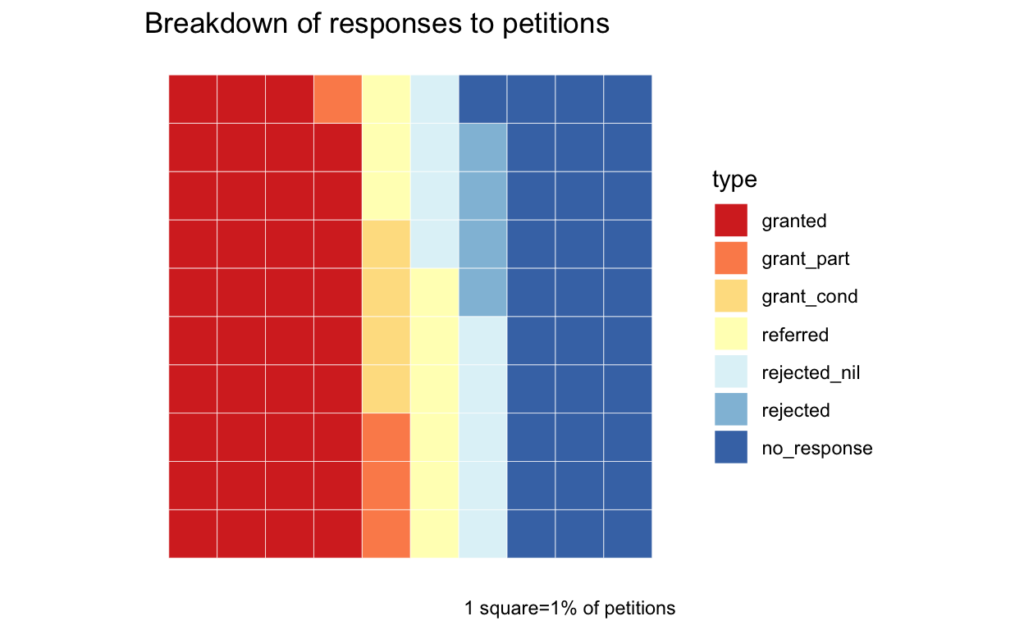
The detailed coding categories:
- granted = request granted in full
- grant_part = request partially granted (eg smaller amount of relief than requested)
- grant_cond = granted, but conditional on the petitioner doing something
- referred = to be further investigated or mediated outside the court, usually by local JPs
- rejected_nil = rejection with only the terse annotation “nil/nihil” or “nothing”
- rejected = rejection with a reason given (including “absent”)
- no_response = no response written on the petition
- uncertain = response (or probable response) couldn’t be interpreted (eg damaged or illegible).
Simplified positive/negative:
- positive = granted, grant_part, grant_cond or referred
- negative = rejected_nil, rejected, no_response
I’ll exclude the small uncertain group from analysis (there are only 20, some of which may not be responses anyway), so I’m looking at 593 petitions.
Overview
How often do petitioners get what they want?
Overall, 56.3% of the 593 petitions received a positive response, which suggests is that petitioners to the Cheshire magistrates had a reasonable chance of getting at least part of what they wanted, but a positive outcome was far from guaranteed.
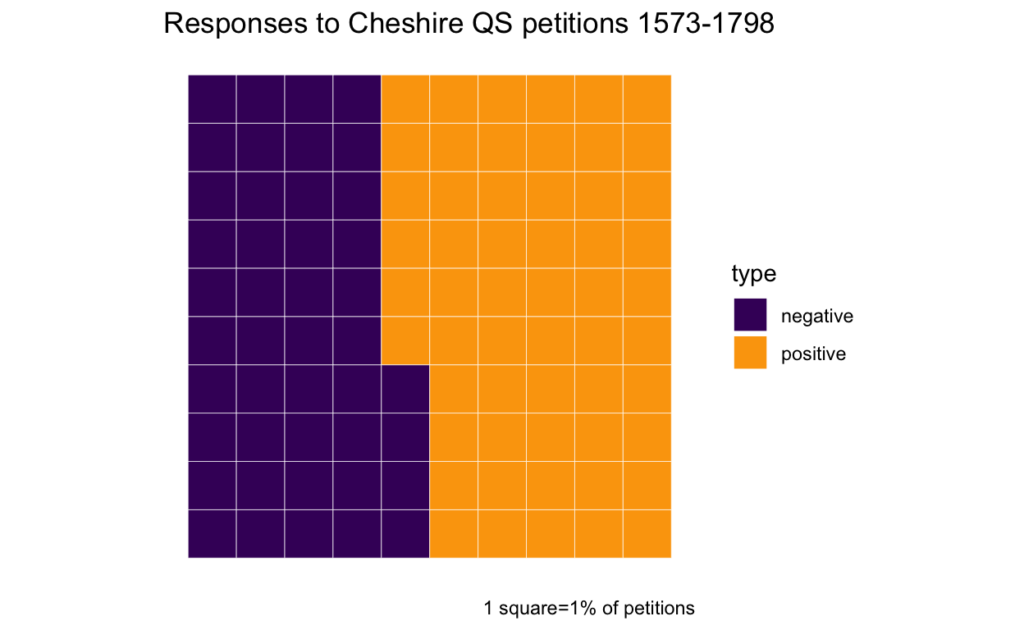
229 (37.3%) requests were granted in full, 50 (8.4%) partially or conditionally and 55 (9.3%) were referred. 75 (12.6%) were rejected with a response and 184 (31%) had no response.
In more depth
Could variations in responses point to factors that increase or reduce the chances of success?
petition topics
This is a set of broad topics manually assigned by the project for QS petitions; a couple of topics with very low numbers (dissenting worship, debtors – <10 petitions) have been merged into the “other” category.
The proportional bar chart on the left shows the detailed breakdown of responses. The smaller chart on the right shows the % of positive responses and the size of the square indicates the relative size of the category.
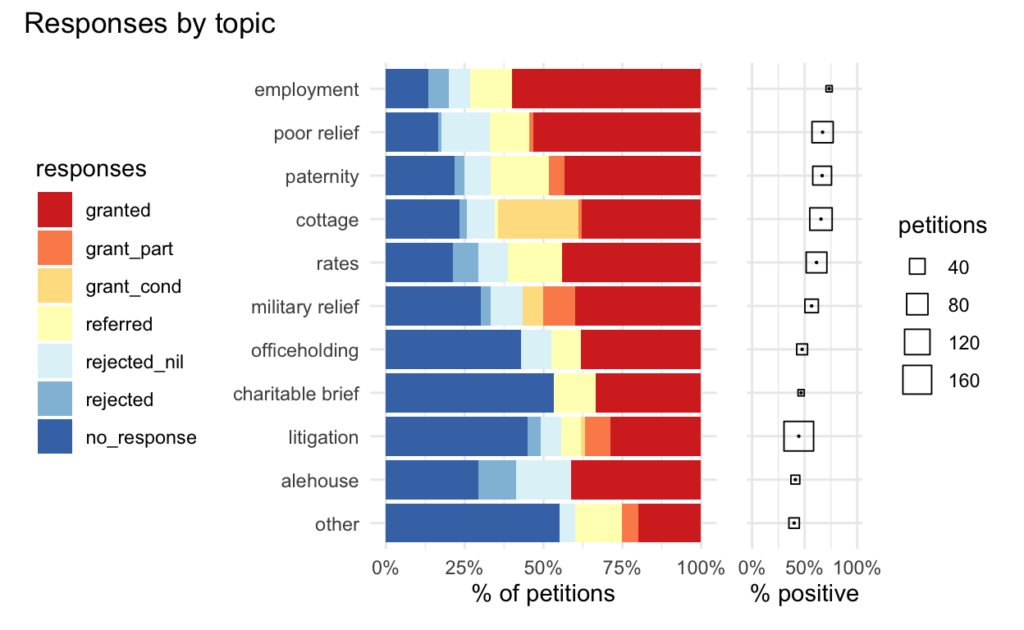
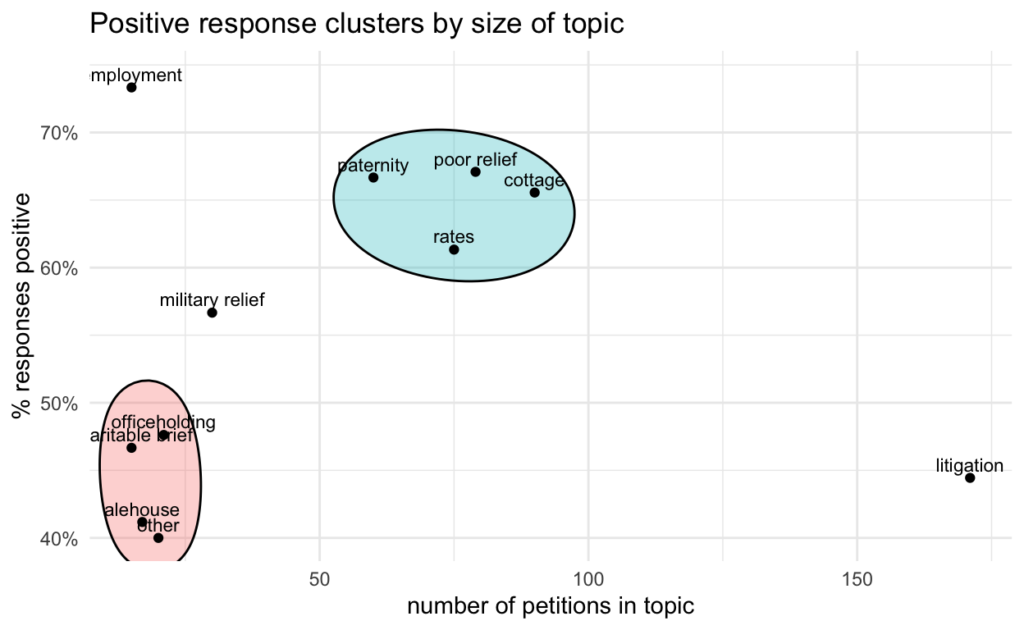
In some categories, the numbers may be too small to draw any real conclusions. Even so, it’s noticeable that there is some relationship between the number of petitions in a topic and the likelihood of a positive response; that’s to say, smaller topic categories are less likely to get a positive response. The exceptions to this pattern are the largest category (litigation, 171 petitions and one of the lowest positive response rates at 44.4%) and employment (15 petitions, 73% positive responses).
Additionally, there are two very distinct clusters in positive response rates.
Another feature to note is the unusually high percentage of conditional responses for cottage petitions; it was very common for a request to be allowed to build a cottage to be granted on condition of obtaining the consent of the lord of the manor.
change over time
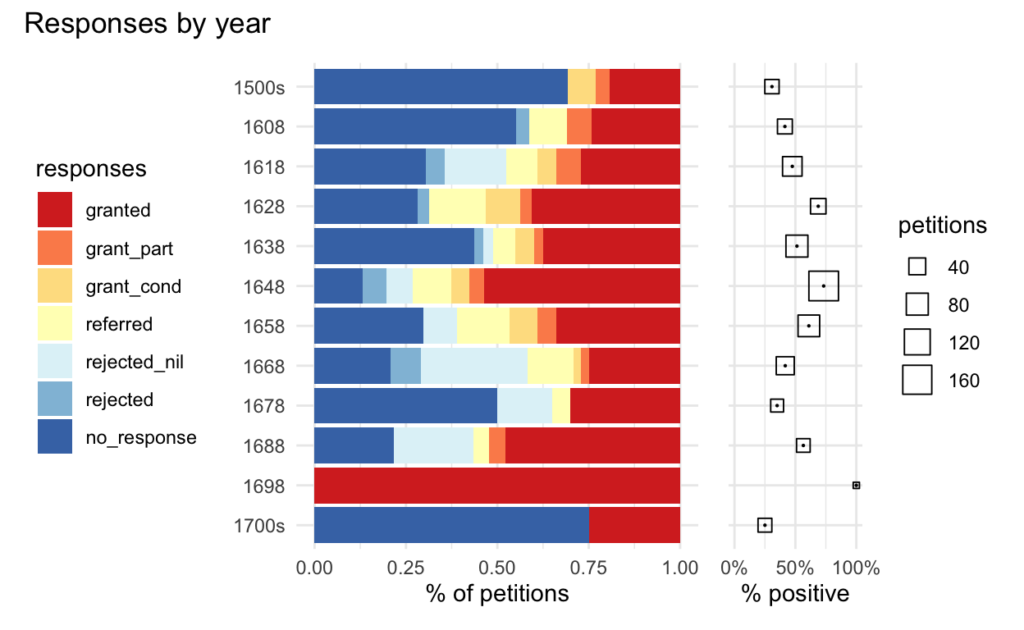
Pre-1600 and post-1700 petitions have been combined because the annual numbers are very small. There were only 7 petitions in 1698, all of them for poor relief, so it’s difficult to be sure why the success rate (100%!) was so exceptional in that year.
The JPs’ diligence in 1648 is particularly noteworthy; there were almost 150 petitions during that year, but only 22 have no response at all. Moreover, apart from 1698, it was the most successful year for petitioners.
There is a possible trend overall – the positive % rising until mid-century and declining afterwards – but 1628 and 1688 really confound any such pattern. Unlike topics, there are no clear clusters or correlations between petition numbers and positive %.
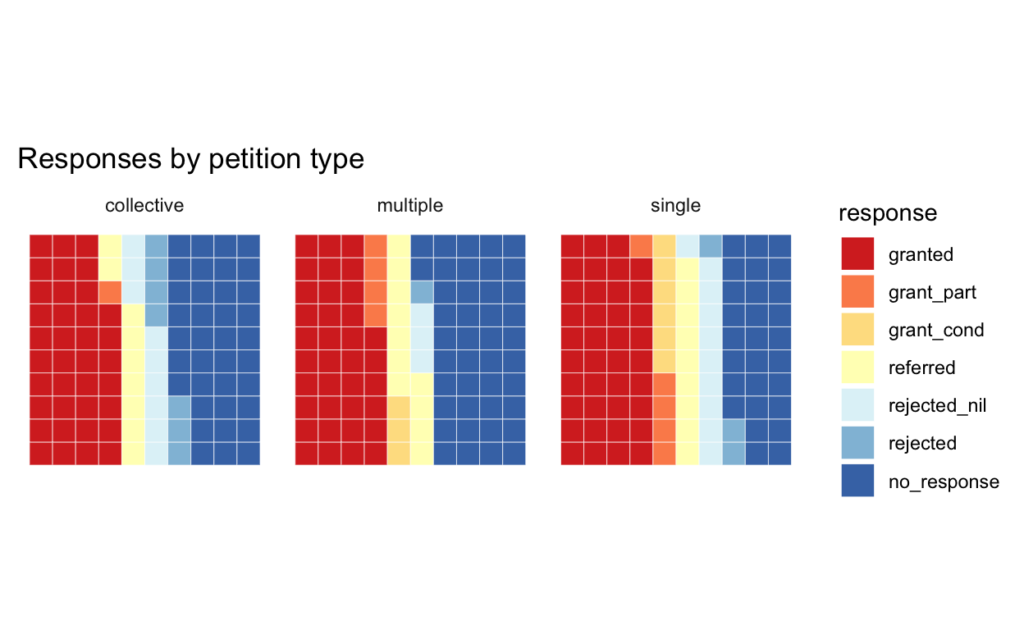
petition type
Variations here appear to be much less significant than previous categories of analysis.
Three types
- single petitioner (413)
- multiple named petitioners (72)
- collective (eg “inhabitants of Nantwich”) (108)
There is very little difference in overall positive/negative responses to the three types, though single-petitioner petitions are slightly more likely to receive a positive response.
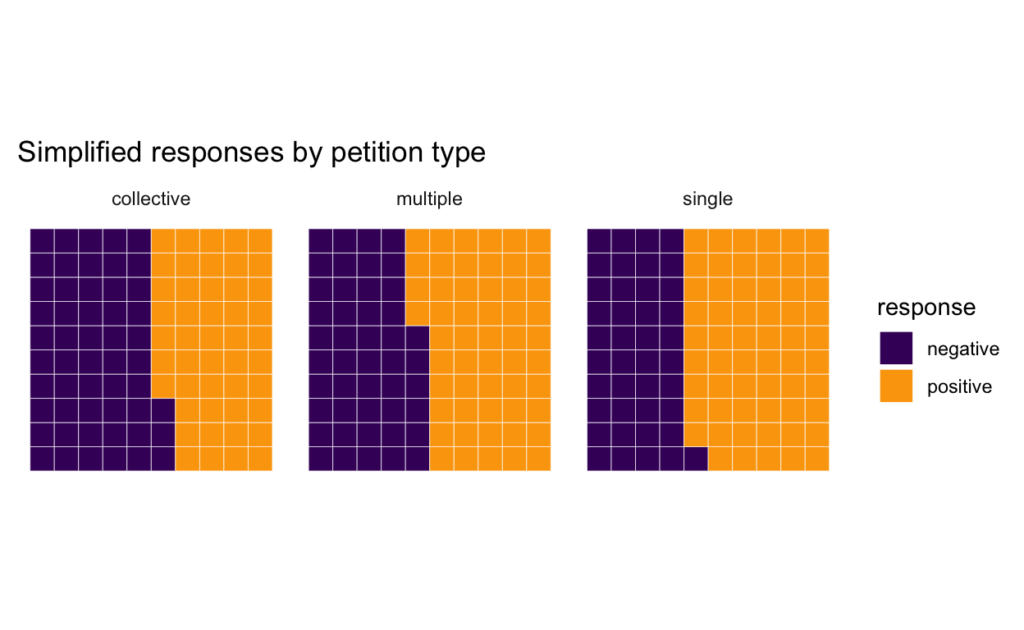
The responses breakdown does show more variation. The single category is far less likely to get no response at all, and is most likely to have requests granted in full. (But, interestingly, collective petitions are most likely to have a reason given for rejection.)
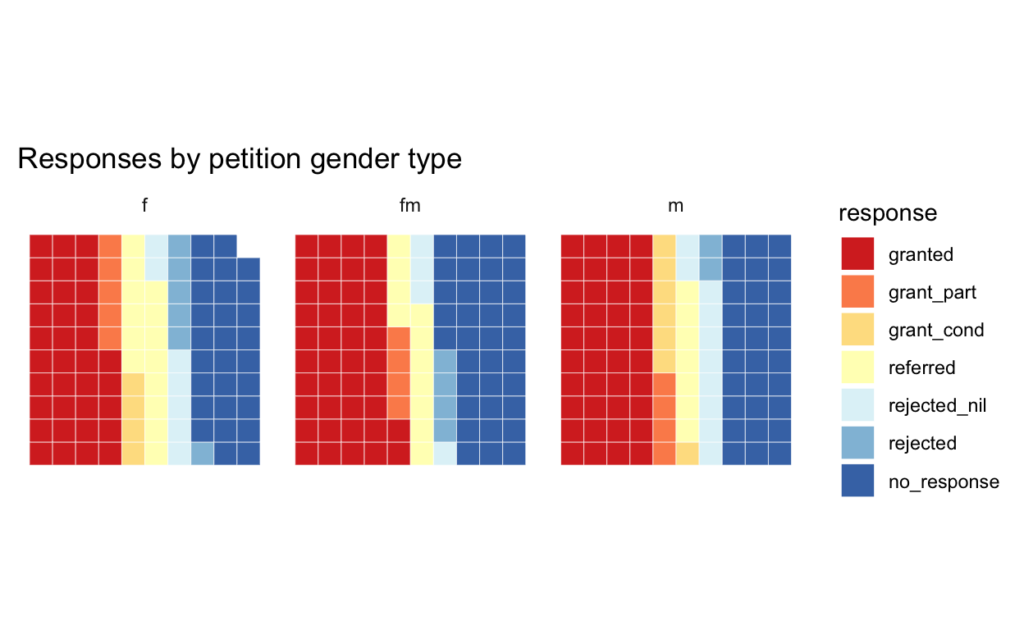
petition gender type
(Collective petitions excluded.)
A summary of gender of all petitioners (but not additional subscribers) per petition:
- f = female only (128 petitions)
- m = male only (343)
- fm = mixed gender (26)
Again there is very little variation in positive response rates. I might have expected slightly more variation in this category as I know there are gendered variations in petition topics; I’ll need to explore this further.
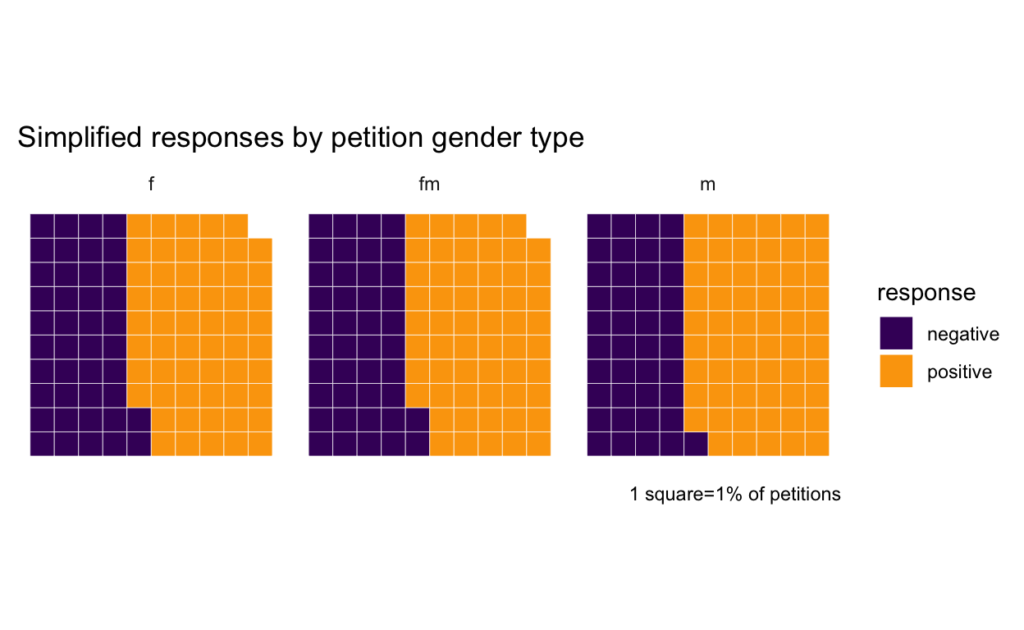
And again, the more detailed breakdown of responses shows up more subtle variations. It appears that petitions involving female petitioners were less likely to have requests granted in full and more likely to have their cases referred to JPs for further investigation.